We have changed the way we set premium rates for the 300,000 Ontario businesses covered by our workplace injury and illness insurance.
Our new model came into effect January 1, 2020, changing the way businesses are classified, boosting fairness and increasing transparency in how premium rates are set and adjusted.
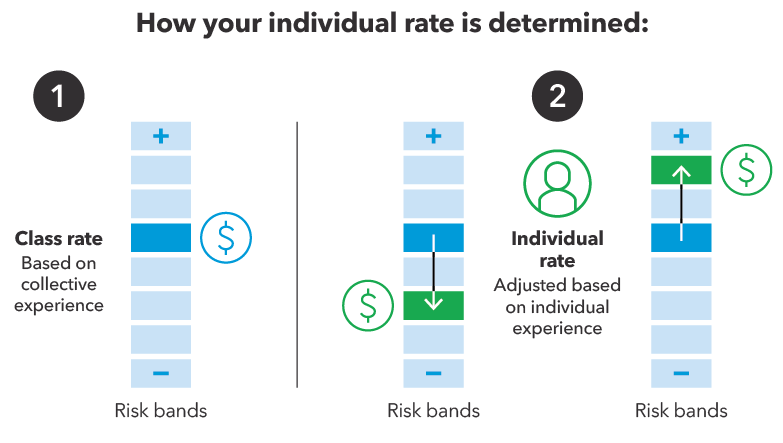
The new model uses a two-step approach to set and adjust premium rates for businesses.
- Step one involves setting an average rate for each industry class based on their risk profile and share of responsibility to maintain the insurance fund.
- Step two looks at how your individual claim history compares to the rest of the businesses in your class. This means that your overall rate under the new model will reflect your individual claims experience and risk.
We use the insurable earnings, claims costs and the number of allowed claims, over a six-year period to set premium rates. For new businesses with less than one year of experience, your premium rate will be the class rate.
This approach ensure that businesses are paying a rate that is reflective of their industry and experience.
Learn more about your 2020 premium rates and the policies guiding our rate-setting process.
Key features of our new premium rate-setting model
Classification
We have moved to the North American Industry Classification System (NAICS). Our classifications are streamlined from 155 rate groups down to just 34 classes/subclasses, making it easier for businesses to understand how they are classified.
Under NAICS, your business is assigned one or more six–digit industry classification code(s), based on your business activities. If your business has more than one business activity, you are classified according to your predominant business activity – the business activity with the highest amount of insurable earnings.
You can review your business's classification in our new Employer Classification Manual. You can also see what classes/subclasses businesses have mapped to based on their predominant rate group under the old system using our predominant mapping chart.


Class rate
The class rate represents the premium rate a business would pay based on the collective risk profile for all the businesses within the class and your class's shared responsibility to maintain the insurance fund. If the class rate changes as a result of the overall claims experience of that class, it will impact the other risk band rates within that class.
Risk bands
Each NAICS class has a series of risk bands and each risk band has an associated rate, either above or below the class rate.
Your business is assigned to a risk band that best represents your risk in relation to other businesses in your class. The risk band rate includes rate adjustments based on your individual experience.
Businesses that fall under the same risk band rate have similar risk profiles and will pay the same rate. The difference between successive risk band rates is approximately 5 per cent.
Predictability
A business's predictability is a measure of how much we can rely on your past claims experience and insurable earnings to predict future outcomes. Your rate is calculated using the class rate and the individual risk associated to your business, which is influenced by your claims experience and insurable earnings over a six-year period.
A low predictability means a business's insurable earnings and the number of allowed claims are quite low. In this case, your claims experience would not have a significant impact on your rate. Instead, the rates of your class will have more influence on your premium rate to protect against volatility and the dramatic effect one claim could have on your rate.
Businesses with a higher number of allowed claims and larger insurable earnings, have a higher predictability. In this case, volatility is not as high, as each single claim likely will not have a significant impact on your rate.
Predictability chart
The below illustrates the correlation between a business's predictability, insurable earnings, and number of allowed claims.
- Data is for the 2019 model year as of May 31 2018 (2012-2017 is six year window considered)
- Maximum insurable earnings in 2019 model year is $92,600
- If you have no allowed claims, the maximum your predictability can be is 80%
| Predictability Scale | Number of Businesses | Minimum insurable earnings (6-yr) ($) | Maximum insurable earnings (6-yr) ($) | Average insurable earnings (6-yr) ($) | Average annual insurable earnings | Minimum number of claims (6-yr) | Maximum number of claims (6-yr) | Average number of claims (6-yr) |
|---|---|---|---|---|---|---|---|---|
| 2.50% | 201,357 | 1 | 1,234,785 | 258,899 | 43,150 | 0.0 | 4 | 0 |
| 5.00% | 42,660 | 66,000 | 4,939,770 | 1,823,009 | 303,835 | 0.0 | 15 | 1 |
| 10.00% | 21,966 | 782,478 | 19,737,647 | 6,163,354 | 1,027,226 | 0.0 | 40 | 5 |
| 20.00% | 8,179 | 5,615,158 | 74,593,203 | 22,135,604 | 3,689,267 | 0.0 | 268 | 23 |
| 30.00% | 1,560 | 25,240,874 | 160,000,004 | 69,428,227 | 11,571,371 | 0.0 | 456 | 68 |
| 40.00% | 503 | 51,053,355 | 288,087,902 | 142,588,870 | 23,764,812 | 0.0 | 525 | 128 |
| 50.00% | 236 | 100,871,679 | 465,458,414 | 247,713,612 | 41,285,602 | 0.0 | 736 | 192 |
| 60.00% | 120 | 128,215,885 | 642,219,990 | 365,988,462 | 60,998,077 | 2.0 | 1,617 | 318 |
| 70.00% | 79 | 286,903,182 | 900,918,643 | 527,390,706 | 87,898,451 | 4.0 | 1,586 | 382 |
| 80.00% | 63 | 419,484,637 | 1,423,098,177 | 705,647,531 | 117,607,922 | 11.0 | 1,854 | 576 |
| 90.00% | 31 | 660,743,077 | 4,968,411,750 | 1,109,807,493 | 184,967,916 | 60.0 | 1,920 | 730 |
| 100.00% | 81 | 837,298,314 | 5,632,902,578 | 2,058,491,610 | 343,081,935 | 530.0 | 8,186 | 1,815 |
| Grand Total | 276,835 |
Updated: