In 2010, following consultation with stakeholders, the WSIB Board of Directors decided to increase the average premium rate for employers by 2 per cent in 2011 and 2012. Premium rates for employer rate groups will increase by 2 per cent for 2012 so that employers contribute towards the financial stability of the workplace insurance system.
Any proposed changes to the premium rate structure resulting from the Harry Arthurs review would not come into effect until 2013. Ontario’s workplace insurance system is in a transition period until then, and the modest premium rate increase for 2012 is the minimum necessary to stabilize the system’s finances while being fair to the workers and employers who rely on it.
Reducing injuries and implementing a healthy and safe workplace is still the best way to help reduce costs. Employers who have effective health and safety and work reintegration programs can take advantage of financial incentives to reduce their workplace insurance costs. Learn how the WSIB is working for you - check out the resources, tools, and programs available to assist you.
The WSIB maximum insurable earnings ceiling for 2012 is $81,700. This is an increase of 2.6 per cent from $79,600 in 2011. Changes to the Maximum Insurable Earnings Ceiling are directly linked to changes in average earnings in Ontario as measured by Statistics Canada, and provisions under the Workplace Safety and Insurance Act.
Premium rates table
Your rate group number appears on your WSIB Premium Remittance Form. Our 2012 premium rates backgrounder contains additional information.
Read our 2012 Premium Rates Manual (PDF).
Learn more
We know that you may have questions about your 2012 rate. You may want to know how rates are set, and what you can do to improve your rate group’s performance in future years.
Representatives in your local WSIB office have additional information about your 2012 premium rate; the WSIB’s premium rate setting process; and the wide range of information, incentives and initiatives that are available to Ontario employers. They will be happy to answer any questions you may have.
The WSIB and Health and Safety Ontario are here to work with you to improve your work reintegration and workplace health and safety programs.
2012 premium rates table
Note: 2012 premium rates have been calculated based on a 2-per-cent increase across all rate groups, rounded to the nearest cent.
| Rate Group | Description | 2012 Premium Rate ($) |
2011 Premium Rate ($) |
Premium rate change as % of 2011 payroll |
|---|---|---|---|---|
| 030 | Logging | 12.72 | 12.47 | 0.3% |
| 033 | Mill Products And Forestry Services | 8.59 | 8.42 | 0.2% |
| 036 | Veneers, Plywood And Wood Preservation | 5.24 | 5.14 | 0.1% |
| 039 | Pulp, Newsprint And Specialty Papers | 2.86 | 2.80 | 0.1% |
| 041 | Corrugated Boxes | 3.16 | 3.10 | 0.1% |
| 110 | Gold Mines | 7.95 | 7.79 | 0.2% |
| 113 | Nickel Mines | 5.08 | 4.98 | 0.1% |
| 119 | Other Mines | 6.53 | 6.40 | 0.1% |
| 134 | Aggregates | 6.36 | 6.24 | 0.1% |
| 159 | Livestock Farms | 6.92 | 6.78 | 0.1% |
| 167 | Field Crop, Fruit And Vegetable Farms | 2.77 | 2.72 | 0.0% |
| 174 | Tobacco And Mushroom Farms | 5.03 | 4.93 | 0.1% |
| 181 | Fishing And Miscellaneous Farming | 3.58 | 3.51 | 0.1% |
| 184 | Poultry Farms And Agricultural Services | 3.19 | 3.13 | 0.1% |
| 190 | Landscaping And Related Services | 4.81 | 4.72 | 0.1% |
| 207 | Meat And Fish Products | 4.55 | 4.46 | 0.1% |
| 210 | Poultry Products | 3.42 | 3.35 | 0.1% |
| 214 | Fruit And Vegetable Products | 2.62 | 2.57 | 0.1% |
| 216 | Dairy Products | 2.21 | 2.17 | 0.0% |
| 220 | Other Bakery Products | 3.91 | 3.83 | 0.1% |
| 222 | Confectionery | 1.76 | 1.73 | 0.0% |
| 223 | Biscuits, Snack Foods And Other Food Products | 2.73 | 2.68 | 0.0% |
| 226 | Crushed And Ground Foods | 1.65 | 1.62 | 0.0% |
| 230 | Alcoholic Beverages | 1.52 | 1.49 | 0.0% |
| 231 | Soft Drinks | 3.50 | 3.43 | 0.1% |
| 238 | Other Rubber Products | 4.03 | 3.95 | 0.1% |
| 258 | Foamed And Expanded Plastic Products | 2.85 | 2.79 | 0.1% |
| 261 | Plastic Film And Sheeting | 2.40 | 2.35 | 0.0% |
| 263 | Other Plastic Products | 3.15 | 3.09 | 0.1% |
| 289 | Cloth, Carpets And Textile Products | 3.62 | 3.55 | 0.1% |
| 301 | Clothing, Fibre And Yarn | 2.37 | 2.32 | 0.1% |
| 308 | Millwork And Other Wood Industries | 5.44 | 5.33 | 0.1% |
| 311 | Wooden Cabinets | 4.06 | 3.98 | 0.1% |
| 312 | Wooden Boxes And Pallets | 6.97 | 6.83 | 0.1% |
| 322 | Upholstered Furniture | 3.26 | 3.20 | 0.1% |
| 323 | Metal Furniture | 2.28 | 2.24 | 0.0% |
| 325 | Wooden And Other Non-Metal Furniture | 4.20 | 4.12 | 0.1% |
| 328 | Furniture Parts And Fixtures | 4.07 | 3.99 | 0.1% |
| 333 | Printing, Platemaking And Binding | 1.71 | 1.68 | 0.0% |
| 335 | Publishing | 0.55 | 0.54 | 0.0% |
| 338 | Folding Cartons | 2.59 | 2.54 | 0.0% |
| 341 | Paper Products | 3.11 | 3.05 | 0.1% |
| 352 | Steel And Other Smelting And Refining Industries | 2.56 | 2.51 | 0.1% |
| 358 | Foundries | 4.19 | 4.11 | 0.1% |
| 361 | Non-Ferrous Metal Industries | 3.51 | 3.44 | 0.1% |
| 374 | Doors And Windows | 3.48 | 3.41 | 0.1% |
| 375 | Structural And Architectural Products | 4.60 | 4.51 | 0.1% |
| 377 | Coating Of Metal Products | 4.09 | 4.01 | 0.1% |
| 379 | Hardware, Tools And Cutlery | 2.68 | 2.63 | 0.1% |
| 382 | Metal Dies, Moulds And Patterns | 2.17 | 2.13 | 0.0% |
| 383 | Heating, Refrigeration And Air Conditioning Equipment | 2.72 | 2.67 | 0.1% |
| 385 | Machine Shops | 2.55 | 2.50 | 0.0% |
| 387 | Other Metal Fabricating Industries | 3.59 | 3.52 | 0.1% |
| 389 | Metal Closures And Containers | 2.53 | 2.48 | 0.0% |
| 390 | Other Stamped And Pressed Metal Products | 3.51 | 3.44 | 0.1% |
| 393 | Wire Products | 3.29 | 3.23 | 0.1% |
| 402 | Major Appliances And Transmission Equipment | 2.27 | 2.23 | 0.0% |
| 403 | Other Machinery And Equipment | 1.70 | 1.67 | 0.0% |
| 406 | Elevators And Escalators | 2.64 | 2.59 | 0.1% |
| 408 | Boilers, Pumps And Fans | 2.40 | 2.35 | 0.0% |
| 411 | Agricultural, Construction And Mining Machinery | 2.82 | 2.76 | 0.1% |
| 417 | Aircraft Manufacturing | 1.53 | 1.50 | 0.0% |
| 419 | Motor Vehicle Assembly | 3.51 | 3.44 | 0.1% |
| 420 | Motor Vehicle Engine Manufacturing | 1.85 | 1.81 | 0.0% |
| 421 | Other Motor Vehicle Parts And Equipment | 3.51 | 3.44 | 0.1% |
| 424 | Motor Vehicle Stampings | 3.51 | 3.44 | 0.1% |
| 425 | Motor Vehicle Wheels And Brakes | 3.51 | 3.44 | 0.1% |
| 428 | Motor Vehicle Fabric Accessories | 4.47 | 4.38 | 0.1% |
| 432 | Trucks, Buses And Trailers | 4.29 | 4.21 | 0.1% |
| 442 | Railroad Rolling Stock | 2.68 | 2.63 | 0.1% |
| 460 | Lighting And Small Electrical Appliances | 2.59 | 2.54 | 0.0% |
| 466 | Communication And Energy Wire Products | 2.39 | 2.34 | 0.1% |
| 468 | Electronic Equipment & Other Communication Devices | 0.39 | 0.39 | 0.0% |
| 477 | Industrial Electrical Equipment | 1.52 | 1.49 | 0.0% |
| 485 | Bricks, Ceramics And Abrasives | 4.43 | 4.34 | 0.1% |
| 496 | Concrete Products | 5.29 | 5.19 | 0.1% |
| 497 | Ready-Mix Concrete | 3.84 | 3.76 | 0.1% |
| 501 | Non-Metallic Mineral Products | 2.93 | 2.87 | 0.1% |
| 502 | Glass Products | 2.98 | 2.92 | 0.1% |
| 507 | Petroleum And Coal Products | 1.15 | 1.13 | 0.0% |
| 512 | Resins, Paint, Ink And Adhesives | 1.71 | 1.68 | 0.0% |
| 514 | Pharmaceuticals And Medicines | 0.94 | 0.92 | 0.0% |
| 517 | Soap And Toiletries | 1.64 | 1.61 | 0.0% |
| 524 | Chemical Industries | 1.92 | 1.88 | 0.0% |
| 529 | Jewelry And Instruments | 1.00 | 0.98 | 0.0% |
| 533 | Signs And Displays | 3.12 | 3.06 | 0.1% |
| 538 | Sporting Goods And Toys | 4.18 | 4.10 | 0.1% |
| 542 | Other Manufactured Products | 2.08 | 2.04 | 0.0% |
| 551 | Air Transport Industries | 2.04 | 2.00 | 0.0% |
| 553 | Air Transport Services | 1.89 | 1.85 | 0.0% |
| 560 | Warehousing | 3.35 | 3.28 | 0.1% |
| 570 | General Trucking | 6.56 | 6.43 | 0.1% |
| 577 | Courier Services | 2.95 | 2.89 | 0.1% |
| 580 | Miscellaneous Transport Industries | 4.99 | 4.89 | 0.1% |
| 584 | School Buses | 2.97 | 2.91 | 0.1% |
| 590 | Ambulance Services | 6.30 | 6.18 | 0.1% |
| 604 | Food, Sales | 2.48 | 2.43 | 0.0% |
| 606 | Grocery And Convenience Stores | 2.15 | 2.11 | 0.0% |
| 607 | Specialty Food Stores | 3.64 | 3.57 | 0.1% |
| 608 | Beer Stores | 4.07 | 3.99 | 0.1% |
| 612 | Agricultural Products, Sales | 2.42 | 2.37 | 0.0% |
| 630 | Vehicle Services And Repairs | 3.46 | 3.39 | 0.1% |
| 633 | Petroleum Products, Sales | 2.54 | 2.49 | 0.0% |
| 636 | Other Sales | 1.43 | 1.40 | 0.0% |
| 638 | Pharmacies | 0.69 | 0.68 | 0.0% |
| 641 | Clothing Stores | 1.56 | 1.53 | 0.0% |
| 657 | Automobile And Truck Dealers | 0.79 | 0.78 | 0.0% |
| 668 | Computer, Electronic And Electrical Equipment, Sales | 0.49 | 0.48 | 0.0% |
| 670 | Machinery And Other Vehicles, Sales | 1.80 | 1.76 | 0.0% |
| 681 | Lumber And Builders Supply | 2.94 | 2.88 | 0.1% |
| 685 | Metal Products, Wholesale | 3.17 | 3.11 | 0.1% |
| 689 | Waste Materials Recycling | 6.02 | 5.90 | 0.1% |
| 704 | Electrical And Incidental Construction Services | 3.60 | 3.53 | 0.1% |
| 707 | Mechanical And Sheet Metal Work | 4.06 | 3.98 | 0.1% |
| 711 | Roadbuilding And Excavating | 5.16 | 5.06 | 0.1% |
| 719 | Inside Finishing | 7.33 | 7.19 | 0.1% |
| 723 | Industrial, Commercial & Institutional Construction | 4.44 | 4.35 | 0.1% |
| 728 | Roofing | 14.44 | 14.16 | 0.3% |
| 732 | Heavy Civil Construction | 6.86 | 6.73 | 0.1% |
| 737 | Millwrighting And Welding | 6.73 | 6.60 | 0.1% |
| 741 | Masonry | 12.39 | 12.15 | 0.2% |
| 748 | Form Work And Demolition | 17.86 | 17.51 | 0.3% |
| 751 | Siding And Outside Finishing | 10.00 | 9.80 | 0.2% |
| 764 | Homebuilding | 8.88 | 8.71 | 0.2% |
| 810 | School Boards | 0.79 | 0.78 | 0.0% |
| 817 | Educational Facilities | 0.36 | 0.36 | 0.0% |
| 830 | Power And Telecommunication Lines | 4.34 | 4.25 | 0.1% |
| 833 | Electric Power Generation | 0.77 | 0.76 | 0.0% |
| 835 | Oil, Power And Water Distribution | 1.05 | 1.03 | 0.0% |
| 838 | Natural Gas Distribution | 0.68 | 0.67 | 0.0% |
| 845 | Local Government Services | 2.19 | 2.15 | 0.0% |
| 851 | Homes For Nursing Care | 3.21 | 3.15 | 0.1% |
| 852 | Homes For Residential Care | 3.22 | 3.16 | 0.1% |
| 853 | Hospitals | 1.08 | 1.06 | 0.0% |
| 857 | Nursing Services | 3.23 | 3.17 | 0.1% |
| 858 | Group Homes | 3.07 | 3.01 | 0.1% |
| 861 | Treatment Clinics And Specialized Services | 1.08 | 1.06 | 0.0% |
| 875 | Professional Offices And Agencies | 0.72 | 0.71 | 0.0% |
| 905 | Apartment And Condominium Services | 2.97 | 2.91 | 0.1% |
| 908 | Other Real Estate Services | 1.28 | 1.25 | 0.0% |
| 911 | Security And Investigation Services | 1.70 | 1.67 | 0.0% |
| 919 | Restaurants And Catering | 1.68 | 1.65 | 0.0% |
| 921 | Hotels, Motels And Camping | 3.03 | 2.97 | 0.1% |
| 923 | Janitorial Services | 3.64 | 3.57 | 0.1% |
| 929 | Supply Of Non-Clerical Labour | 4.93 | 4.83 | 0.1% |
| 933 | Equipment Rental And Repair Services | 3.01 | 2.95 | 0.1% |
| 937 | Recreational Services And Facilities | 2.14 | 2.10 | 0.0% |
| 944 | Personal Services | 3.18 | 3.12 | 0.1% |
| 956 | Legal And Financial Services | 0.21 | 0.21 | 0.0% |
| 958 | Technical And Business Services | 0.38 | 0.38 | 0.0% |
| 962 | Advertising And Entertainment | 1.07 | 1.05 | 0.0% |
| 975 | Linen And Laundry Services | 4.02 | 3.94 | 0.1% |
| 981 | Membership Organizations | 0.78 | 0.77 | 0.0% |
| 983 | Communications Industries | 0.37 | 0.37 | 0.0% |
Premium rates backgrounder
Funding Ontario’s workplace safety and insurance system
All the costs of providing workplace safety and insurance benefits and services to Ontario workplaces are paid for by Ontario employers. Ontario’s workplace safety and insurance system is based on the principle of collective liability, which means that employers who work in similar kinds of industries (with similar kinds of hazards) should be “collectively liable” for the costs of injuries in their industry.
Collective liability means that employers in, for example, the mining industry all pay their fair share of the costs of injuries in mining industry workplaces, while employers in the construction industry share the collective cost of injuries in their workplaces, and so on. (Employers covered under Schedule 2 of the Workplace Safety and Insurance Act, such as airlines, shipping companies and railways, are the exceptions - they pay individually for the full costs of benefits for their injured workers.)
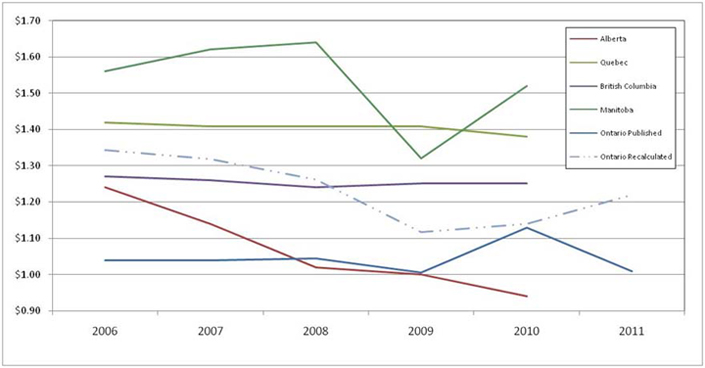
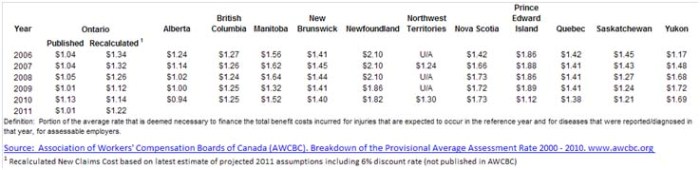
Jurisdictional comparison
It is important to note that, while Ontario employers pay among the highest premiums for workplace insurance, Ontario is not a high-claims-cost jurisdiction. If the financial burden of the unfunded liability did not exist, and premiums could be set based only on covering the costs of new claims, WSIB premiums would be very competitive with other jurisdictions. The chart below shows a comparison of WSIB new-claims-costs premiums with other Canadian jurisdictions.
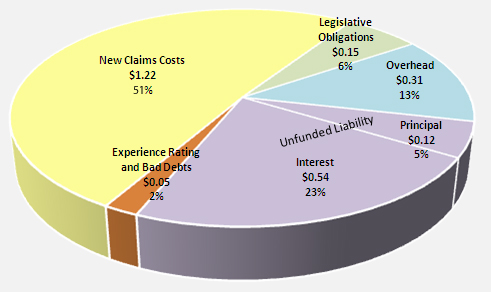
Premium rate components
WSIB premium rates for employer rate groups are made up of three key components:
- Costs of new injuries and illnesses
- Administrative costs, including legislated obligations (Occupational Health and Safety Act, etc.)
- Unfunded liability amortization charge
These components are broken down further in the chart below.
 More details of the components that make up premium rates and an explanation of how they are calculated can be obtained from the Premium Rate Manual, available on the WSIB website.
Minimizing increases to rate-group premium rates
All employers must work to make their workplaces safer, and to develop effective early and safe return-to-work programs. They should also share their workplace health and safety knowledge and experience with other members of their rate groups.
Joint Occupational Health and Safety Committees (required in all workplaces that have more than 20 employees) can help employers identify areas where health and safety improvements are required. Ontario has a health and safety association (HSA) dedicated to serving employers in your industry. More information about HSAs is available from the WSIB website or WSIB Employer Service Representatives.
Compliance is another important factor. If anyone suspects that a business is getting an unfair financial advantage by not registering with the WSIB, not reporting injuries or illnesses, or not paying premiums, they can contact the WSIB’s anonymous Action Line at 1-888-745-3237 or e-mail [email protected].
Incentives for small business employers
Employers in the WSIB’s Merit Adjusted Premium plan (MAP), may have their rate group premium rate adjusted based on their individual accident record.
Maximum Insurable Earnings Ceiling
The WSIB maximum insurable earnings ceiling for 2012 is $81,700. This is an increase of 2.6 per cent from $79,600 in 2011. Changes to the Maximum Insurable Earnings Ceiling are directly linked to changes in average earnings in Ontario as measured by Statistics Canada, and provisions under the Workplace Safety and Insurance Act.
Changes to the Maximum Insurable Earnings Ceiling can result in an increase to the premiums employers pay (to the extent that they have employees who earn more than the maximum).
Under the Workplace Safety and Insurance Act, a worker’s average earnings for workplace insurance purposes cannot exceed 175 per cent of the Ontario average industrial wage for the year. The legislation requires the WSIB to calculate this yearly “Maximum Insurable Earnings Ceiling” based on the most recent published Ontario average industrial wage on July 1 of the preceding year.
The WSIB uses a standard formula to calculate the Maximum Insurable Earnings Ceiling:
$([average weekly earnings aggregate] x 365)/7 x 1.75
(The result is rounded to the nearest hundred dollars.)
Updated: