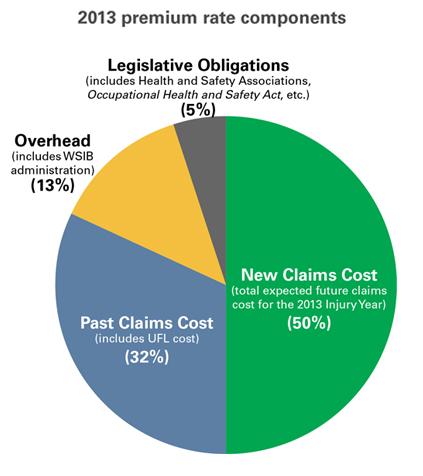
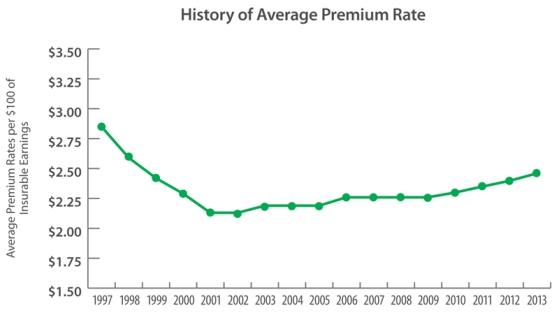
In order to create stable and competitive premium rates for the future and ensure a sustainable workplace safety and insurance system for workers and employers, premium rates will increase by 2.5% for all employer rate groups in 2013. This increased rate is a necessary step to reducing the WSIB’s unfunded liability (UFL), which has grown to $14.2 billion.
This decision by our Board of Directors was made based on sound and detailed actuarial and financial analysis, and will enable us to meet the funding requirements set by the government earlier this year.
The increase is being applied to all rate groups. Our experience rating program remains in place to recognize employers who are performing well and reward them accordingly.
2013 Premium rates table
Note: 2013 premium rates have been calculated based on a 2.5% increase across all rate groups, rounded to the nearest cent.
Read the 2013 Premium rates manual (PDF).
The WSIB maximum insurable earnings ceiling for 2013 is $83,200. This is an increase of 1.8% from $81,700 in 2012. Changes to the Maximum Insurable Earnings Ceiling are directly linked to changes in average earnings in Ontario as measured by Statistics Canada, and provisions under the Workplace Safety and Insurance Act.
| Rate Group | Description | 2013 Premium Rate ($) |
2012 Premium Rate ($) |
|---|---|---|---|
| 030 | Logging | 13.04 | 12.72 |
| 033 | Mill Products And Forestry Services | 8.80 | 8.59 |
| 036 | Veneers, Plywood And Wood Preservation | 5.37 | 5.24 |
| 039 | Pulp, Newsprint And Specialty Papers | 2.93 | 2.86 |
| 041 | Corrugated Boxes | 3.24 | 3.16 |
| 110 | Gold Mines | 8.15 | 7.95 |
| 113 | Nickel Mines | 5.20 | 5.08 |
| 119 | Other Mines | 6.69 | 6.53 |
| 134 | Aggregates | 6.52 | 6.36 |
| 159 | Livestock Farms | 7.09 | 6.92 |
| 167 | Field Crop, Fruit And Vegetable Farms | 2.84 | 2.77 |
| 174 | Tobacco And Mushroom Farms | 5.15 | 5.03 |
| 181 | Fishing And Miscellaneous Farming | 3.67 | 3.58 |
| 184 | Poultry Farms And Agricultural Services | 3.27 | 3.19 |
| 190 | Landscaping And Related Services | 4.93 | 4.81 |
| 207 | Meat And Fish Products | 4.66 | 4.55 |
| 210 | Poultry Products | 3.50 | 3.42 |
| 214 | Fruit And Vegetable Products | 2.68 | 2.62 |
| 216 | Dairy Products | 2.26 | 2.21 |
| 220 | Other Bakery Products | 4.00 | 3.91 |
| 222 | Confectionery | 1.80 | 1.76 |
| 223 | Biscuits, Snack Foods And Other Food Products | 2.79 | 2.73 |
| 226 | Crushed And Ground Foods | 1.69 | 1.65 |
| 230 | Alcoholic Beverages | 1.55 | 1.52 |
| 231 | Soft Drinks | 3.58 | 3.50 |
| 238 | Other Rubber Products | 4.13 | 4.03 |
| 258 | Foamed And Expanded Plastic Products | 2.92 | 2.85 |
| 261 | Plastic Film And Sheeting | 2.46 | 2.40 |
| 263 | Other Plastic Products | 3.23 | 3.15 |
| 289 | Cloth, Carpets And Textile Products | 3.71 | 3.62 |
| 301 | Clothing, Fibre And Yarn | 2.43 | 2.37 |
| 308 | Millwork And Other Wood Industries | 5.57 | 5.44 |
| 311 | Wooden Cabinets | 4.16 | 4.06 |
| 312 | Wooden Boxes And Pallets | 7.14 | 6.97 |
| 322 | Upholstered Furniture | 3.34 | 3.26 |
| 323 | Metal Furniture | 2.33 | 2.28 |
| 325 | Wooden And Other Non-Metal Furniture | 4.30 | 4.20 |
| 328 | Furniture Parts And Fixtures | 4.17 | 4.07 |
| 333 | Printing, Platemaking And Binding | 1.75 | 1.71 |
| 335 | Publishing | 0.56 | 0.55 |
| 338 | Folding Cartons | 2.65 | 2.59 |
| 341 | Paper Products | 3.18 | 3.11 |
| 352 | Steel And Other Smelting And Refining Industries | 2.62 | 2.56 |
| 358 | Foundries | 4.29 | 4.19 |
| 361 | Non-Ferrous Metal Industries | 3.59 | 3.51 |
| 374 | Doors And Windows | 3.56 | 3.48 |
| 375 | Structural And Architectural Products | 4.71 | 4.60 |
| 377 | Coating Of Metal Products | 4.19 | 4.09 |
| 379 | Hardware, Tools And Cutlery | 2.74 | 2.68 |
| 382 | Metal Dies, Moulds And Patterns | 2.22 | 2.17 |
| 383 | Heating, Refrigeration And Air Conditioning Equipment | 2.78 | 2.72 |
| 385 | Machine Shops | 2.61 | 2.55 |
| 387 | Other Metal Fabricating Industries | 3.68 | 3.59 |
| 389 | Metal Closures And Containers | 2.59 | 2.53 |
| 390 | Other Stamped And Pressed Metal Products | 3.59 | 3.51 |
| 393 | Wire Products | 3.37 | 3.29 |
| 402 | Major Appliances And Transmission Equipment | 2.32 | 2.27 |
| 403 | Other Machinery And Equipment | 1.74 | 1.70 |
| 406 | Elevators And Escalators | 2.70 | 2.64 |
| 408 | Boilers, Pumps And Fans | 2.46 | 2.40 |
| 411 | Agricultural, Construction And Mining Machinery | 2.89 | 2.82 |
| 417 | Aircraft Manufacturing | 1.56 | 1.53 |
| 419 | Motor Vehicle Assembly | 3.59 | 3.51 |
| 420 | Motor Vehicle Engine Manufacturing | 1.89 | 1.85 |
| 421 | Other Motor Vehicle Parts And Equipment | 3.59 | 3.51 |
| 424 | Motor Vehicle Stampings | 3.59 | 3.51 |
| 425 | Motor Vehicle Wheels And Brakes | 3.59 | 3.51 |
| 428 | Motor Vehicle Fabric Accessories | 4.58 | 4.47 |
| 432 | Trucks, Buses And Trailers | 4.39 | 4.29 |
| 442 | Railroad Rolling Stock | 2.74 | 2.68 |
| 460 | Lighting And Small Electrical Appliances | 2.65 | 2.59 |
| 466 | Communication And Energy Wire Products | 2.45 | 2.39 |
| 468 | Electronic Equipment & Other Communication Devices | 0.39 | 0.39 |
| 477 | Industrial Electrical Equipment | 1.55 | 1.52 |
| 485 | Bricks, Ceramics And Abrasives | 4.54 | 4.43 |
| 496 | Concrete Products | 5.42 | 5.29 |
| 497 | Ready-Mix Concrete | 3.93 | 3.84 |
| 501 | Non-Metallic Mineral Products | 3.00 | 2.93 |
| 502 | Glass Products | 3.05 | 2.98 |
| 507 | Petroleum And Coal Products | 1.17 | 1.15 |
| 512 | Resins, Paint, Ink And Adhesives | 1.75 | 1.71 |
| 514 | Pharmaceuticals And Medicines | 0.96 | 0.94 |
| 517 | Soap And Toiletries | 1.68 | 1.64 |
| 524 | Chemical Industries | 1.96 | 1.92 |
| 529 | Jewelry And Instruments | 1.02 | 1.00 |
| 533 | Signs And Displays | 3.19 | 3.12 |
| 538 | Sporting Goods And Toys | 4.28 | 4.18 |
| 542 | Other Manufactured Products | 2.13 | 2.08 |
| 551 | Air Transport Industries | 2.09 | 2.04 |
| 553 | Air Transport Services | 1.93 | 1.89 |
| 560 | Warehousing | 3.43 | 3.35 |
| 570 | General Trucking | 6.72 | 6.56 |
| 577 | Courier Services | 3.02 | 2.95 |
| 580 | Miscellaneous Transport Industries | 5.11 | 4.99 |
| 584 | School Buses | 3.04 | 2.97 |
| 590 | Ambulance Services | 6.46 | 6.30 |
| 604 | Food, Sales | 2.54 | 2.48 |
| 606 | Grocery And Convenience Stores | 2.20 | 2.15 |
| 607 | Specialty Food Stores | 3.73 | 3.64 |
| 608 | Beer Stores | 4.17 | 4.07 |
| 612 | Agricultural Products, Sales | 2.48 | 2.42 |
| 630 | Vehicle Services And Repairs | 3.54 | 3.46 |
| 633 | Petroleum Products, Sales | 2.60 | 2.54 |
| 636 | Other Sales | 1.46 | 1.43 |
| 638 | Pharmacies | 0.70 | 0.69 |
| 641 | Clothing Stores | 1.59 | 1.56 |
| 657 | Automobile And Truck Dealers | 0.81 | 0.79 |
| 668 | Computer, Electronic And Electrical Equipment, Sales | 0.50 | 0.49 |
| 670 | Machinery And Other Vehicles, Sales | 1.84 | 1.80 |
| 681 | Lumber And Builders Supply | 3.01 | 2.94 |
| 685 | Metal Products, Wholesale | 3.25 | 3.17 |
| 689 | Waste Materials Recycling | 6.17 | 6.02 |
| 704 | Electrical And Incidental Construction Services | 3.69 | 3.60 |
| 707 | Mechanical And Sheet Metal Work | 4.16 | 4.06 |
| 711 | Roadbuilding And Excavating | 5.29 | 5.16 |
| 719 | Inside Finishing | 7.51 | 7.33 |
| 723 | Industrial, Commercial & Institutional Construction | 4.55 | 4.44 |
| 728 | Roofing | 14.80 | 14.44 |
| 732 | Heavy Civil Construction | 7.03 | 6.86 |
| 737 | Millwrighting And Welding | 6.90 | 6.73 |
| 741 | Masonry | 12.70 | 12.39 |
| 748 | Form Work And Demolition | 18.31 | 17.86 |
| 751 | Siding And Outside Finishing | 10.25 | 10.00 |
| 755* | Non-Exempt Partners and Executive Officers in Construction | 0.21 | N/A |
| 764 | Homebuilding | 9.10 | 8.88 |
| 810 | School Boards | 0.81 | 0.79 |
| 817 | Educational Facilities | 0.36 | 0.36 |
| 830 | Power And Telecommunication Lines | 4.45 | 4.34 |
| 833 | Electric Power Generation | 0.78 | 0.77 |
| 835 | Oil, Power And Water Distribution | 1.07 | 1.05 |
| 838 | Natural Gas Distribution | 0.69 | 0.68 |
| 845 | Local Government Services | 2.24 | 2.19 |
| 851 | Homes For Nursing Care | 3.29 | 3.21 |
| 852 | Homes For Residential Care | 3.30 | 3.22 |
| 853 | Hospitals | 1.10 | 1.08 |
| 857 | Nursing Services | 3.31 | 3.23 |
| 858 | Group Homes | 3.14 | 3.07 |
| 861 | Treatment Clinics And Specialized Services | 1.10 | 1.08 |
| 875 | Professional Offices And Agencies | 0.73 | 0.72 |
| 905 | Apartment And Condominium Services | 3.04 | 2.97 |
| 908 | Other Real Estate Services | 1.31 | 1.28 |
| 911 | Security And Investigation Services | 1.74 | 1.70 |
| 919 | Restaurants And Catering | 1.72 | 1.68 |
| 921 | Hotels, Motels And Camping | 3.10 | 3.03 |
| 923 | Janitorial Services | 3.73 | 3.64 |
| 929 | Supply Of Non-Clerical Labour | 5.05 | 4.93 |
| 933 | Equipment Rental And Repair Services | 3.08 | 3.01 |
| 937 | Recreational Services And Facilities | 2.19 | 2.14 |
| 944 | Personal Services | 3.26 | 3.18 |
| 956 | Legal And Financial Services | 0.21 | 0.21 |
| 958 | Technical And Business Services | 0.38 | 0.38 |
| 962 | Advertising And Entertainment | 1.09 | 1.07 |
| 975 | Linen And Laundry Services | 4.12 | 4.02 |
| 981 | Membership Organizations | 0.79 | 0.78 |
| 983 | Communications Industries | 0.37 | 0.37 |
|
* New Rate Group for 2013 |
|||
Financial discipline to get the most value out of your premium dollars
Employers can be confident that we are using their premium dollars wisely. We’ve brought increased financial discipline to the way we manage our insurance fund, and our hard work is getting results. Today workers are getting decisions on their claims faster than before, and they are getting back to work faster and safer. In 2011, for the first time in 10 years, we are reporting an operating surplus in terms of revenues compared to expenses, and so far results in 2012 are even more encouraging.
Did you know?
- 91% of injured workers are getting back to work within a year
- The WSIB has one of the lowest costs for new claims and administration among all of the provinces
- The WSIB had its first surplus in a decade in 2011: $352 million
More consistent and rigorous case management and better support for recovery and return to work is resulting in improvements that benefit workers, employers, and the Ontario economy. These results include:
- 93% of eligibility decisions made within two weeks, compared to 65% in 2008
- 98% of telephone calls from employers are answered live within one minute, compared to 50% in 2010
- A significant drop in the average length of time on claim, and the number of workers needing 100% wage loss support
Everyone is contributing to improved results
Workers and employers continue to make their workplace safer and healthier, resulting in fewer Lost Time Injuries (LTIs). At the same time, more consistent and rigorous case management and better support for recovery and return to work have assisted in getting workers back to work earlier and more safely.
These improvements have reduced annual benefit payments by almost $500 million over the past couple of years alone. We are managing well, and we are now in a position to eliminate the UFL.
Addressing the unfunded liability (UFL)
The WSIB is carrying a $14.2 billion debt, or UFL. This is the shortfall between the money the WSIB needs to pay benefits in the future and the money that is actually there in the system. Because of this UFL, workplace insurance premiums in Ontario are among the highest in Canada.
Did you know?
- 30% of premiums go to paying down the UFL
For various reasons premiums in the past were not sufficient to cover the cost of claims. This has created an unfortunate situation where current employers are faced with paying the costs of the past.
Absent the need to service the UFL, Ontario would have among the lowest premium rates in the country. That is where we want to be.
While the premium rate increase for 2013 may add costs today, the retirement of the UFL will result in lower premiums and strengthened competitiveness for Ontario businesses in the longer term.
What can employers do to keep their workplace insurance costs down in 2013?
About 95% of premiums paid by most employers are experience-rated. That means employers who have safe workplaces and effective return-to-work programs can reduce their annual premiums paid.
Employers should also stay focused on preventing injuries and illnesses in the workplace. When incidents do occur, make sure they are reported early, because early intervention can help workers return to work earlier and more safely.
Updated: